On December 18, 2020 Deadnsyde did a video covering the 41% drop in the price of Triterras off of news that Rhodium (owned by the same owner of Triterras) needed to "restructure it's debts". Deadnsyde seen this drop as an overreaction and speculated that there could be a bounce in the near future.
I know little to nothing about Triterras other than what's listed on their website. They own Kratos which is a "custom-built, blockchain-enabled, end-to-end global trade and trade finance platform". Apparently there is a fair amount of industry disruption that this platform provides so I figured I would try a small starter position, partially because I'm not totally bullish on the company but I had just enough faith that there was an overreaction and that it would at the very minimum see a 50% recovery from the drop. To plot out this position I would use a strategy I created for myself called the "Speculative Equity Strategy". I opened a position on December 21st at $8.98.
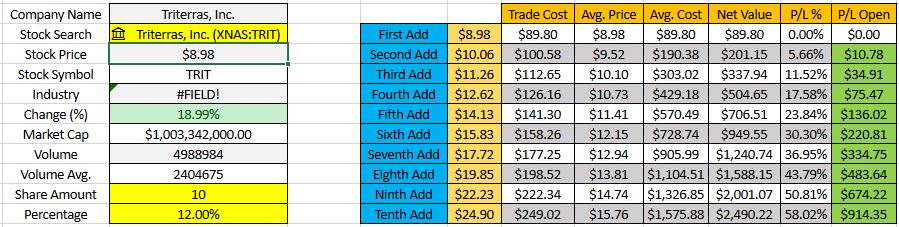
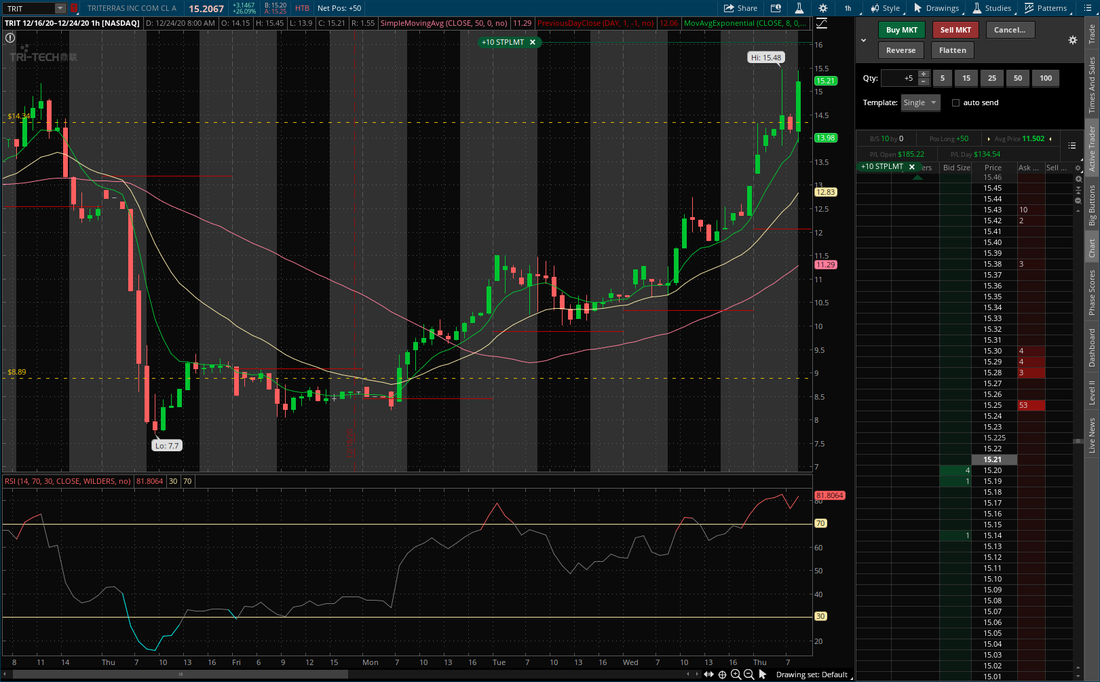
The Speculative Equity Strategy basically is a system of scaling into a position based on the price action of the stock at a set percentage. In the example above I scaled in with increments of 10 shares at every 12% rise in the stock price of my last purchase (you could use any percentage but 12% works better for me). Once I entered in the stock symbol, share amount and percentage in the yellow fields of the excel spreadsheet it populates the fields including the stock price per add, average cost, profit and loss percentage and profit and loss open. You can see an example of it's implementation below.

As you can see it is a bit difficult to get in at exactly the right projected price (stop orders and limit orders are not 100% reliable) but what this system does is that it eliminates emotion out of the trade because you are working towards a projected result. The price may not rise to $14.13 as shown in the example above but at that point you already have achieved a 17.58% profit once it rose up to $12.62. Using this method you can limit your losses if the stock goes against you while being able to map out what your desired P/L % based off of technical data and price action.
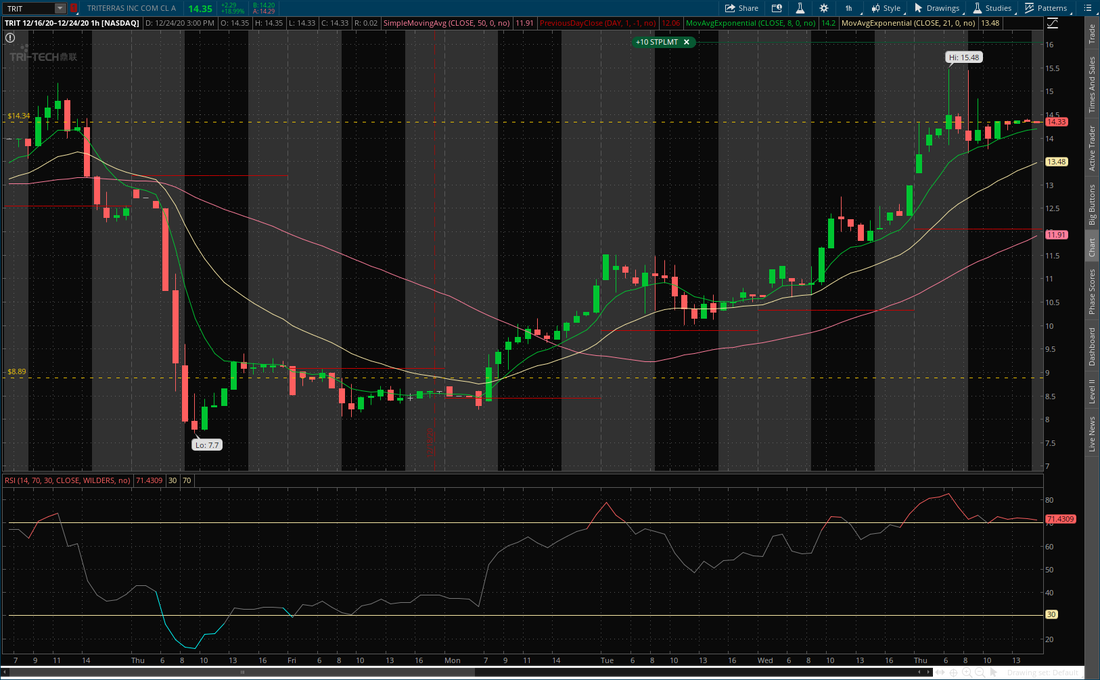
Looking at the example above on December 16th there was a dramatic drop in price when it was at $14.22, once the price rose back up to that level on December 24th the momentum stalled which aligned with my 5th add which was at $14.34. Basically you can plan your profit around support and resistance levels. Most traders would plan on taking profit once the stock retraced it's loss but I think I'll stay in a bit longer to see if it can break the new all-time high at $15.48 before the end of the year. If you are interested in the excel spreadsheet I included it in an attachment below.
0 Comments
Leave a Reply. |
Puts vs. Calls
These are my personal views on my investments and I am not a financial advisor. Please consult with a professional before making any investments. 
Archives
December 2020
Categories
All
|
||
 RSS Feed